
111 North Canal Street ? Chicago, IL 60606
 Kevin Matras rolled up his sleeves to take full advantage of today's market volatility. He has spotted three sectors ready to move--two that are going to surprise the "gurus." And he's ready to pull the trigger on a handful of stock recommendations before they're even on anyone's radar.
Only a few investors will be positioned to beat the market no matter which way it swings. You can be one of them who makes money even in today's turbulence.? Get details below?now ...
Will You Make Money from Today's Historic
Market Opportunity?
Dear Fellow Investor,
I couldn't be more excited about the market right now.
Yes, you read that right. Let me explain.?
First off, back in September 2010, when most of the "gurus" were predicting a market pullback, I foresaw that the?Dow would jump to 12,000.
Hidden inside the market's bearish "Head and Shoulders" pattern was a rare, bullish signal that would send shock waves through the market into late fall and winter.
Soon a line of resistance was crossed. An upside explosion was triggered.
Within 5 months time, the Dow went from 10,751 to as high as 12,391 by February 18, 2011. That was a 1,640-point move, more than +15.3%.
Then in March, we saw that the move was not over, and called for even higher stock prices.
By May 2, 2011, the market rose as high as 12,876, gaining +19.8%.
But that was then, and this is now.
Today, the market and even the world looks quite a bit different.
During our bullish market calls (when others wouldn't believe them), we racked up an impressive set of market-beating winners. Within mere weeks and months, gains amounted to +20%, +25%, +35%, even more than +50%.?
For example, we gained:
+24.8% from LHC Group (LHCG) in just 34 days on a Bullish Rectangle pattern.

+25.0% from? Humana (HUM)?in only 4 months on a Bullish?Ascending Triangle?pattern.

+38.1% from Domino's Pizza (DPZ) in 4 months on a rare Bullish?"Head and Shoulders" failure pattern.

But, as you well know, there are also times when the market goes down. And bearish chart patterns can also present excellent profit opportunities. For example:
+12.1% from?National Instruments (NATI) in just 20 days on a Bearish Descending Triangle pattern.

But if you don't care to short stocks -- you don't have to.
We also take advantage of bearish opportunities by getting into inverse ETFs on the market as well as on individual sectors and industries. A great example was our perfect timing on getting into the inverse S&P 500 ETF on July 27 . . .?
. . . then doubling up on August 2 just in time to catch the Big August 4 Stock Sell-Off.
And that's why I'm so excited about the historic opportunity presented by this convulsing market.?
This may surprise you, but in the long run, it doesn't really matter to me which direction the market moves.?
As long as there's a breakout, either upward or downward -- there's a lot of money to be made.
We've proven we can make money in any direction, and I'm expecting a lot of movement in the coming weeks and months. When you can crank out gains, over and over again, the overall results can be stunning.
Now it's your turn.?
I'm getting ready to pull the trigger on a handful of new stock recommendations to take full advantage of the current situation, both long and short, with both stocks and ETFs.
That's why?I developed the Zacks Chart Patterns Trader. Now let me show you how this alert system has led a private group of investors to big, swift wins in stocks that moved in two opposite directions . . .
Charting Wins Both Long and Short
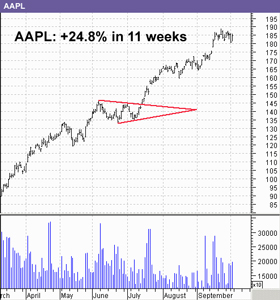
Bullish Symmetrical Triangle
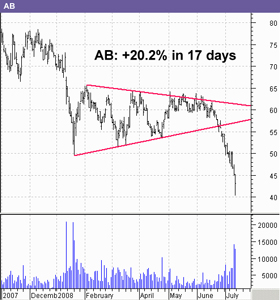
Bearish Symmetrical Triangle
Although the Chart Patterns Trader usually goes long, it also shorts stocks for big gains when the market heads south.
The rewards are extraordinary.?Of course, there?are losses, but look at a few more of the gains that were racked up recently:?
- +10.0% gain from?Horsehead Holdings (ZINC)?in just 3 weeks ("Bullish?Ascending Triangle")
- +52.1% gain from Cooper (COO) in just 6-1/2?months ("Bullish Inverted Head and Shoulders")
- +12.0% gain from?Carbo Ceramics?(CRR) in just 6 weeks ("Bullish Symmetrical Triangle")
- +10.0% gain from Delek US Holdings in just?4 weeks ("Large Bull Pennant")
- +12.3% gain from Valspar (VAL) in just 12 weeks ("Bullish Flagging Pattern")
- +15.7% gain from Andersons (ANDE) in just?5 weeks?("Bullish Ascending Triangle")
- +20.4% gain from?Actuant (ATU)?in just 10 weeks ("Bullish?Ascending Triangle")
Exciting trading days for investors, IF you know how to exploit them.
Fact is, stocks had been beaten down during this recent pullback way more than they should have.
And they're now selling at prices that investors could only have wished for just a few short weeks ago.
Yet, for?many companies, literally nothing has changed except . . . they are now selling at cheaper prices with even lower valuations.
To be fair, there are also many companies that haven't fallen enough, and should drop even further as their days in the sun are over.
So, going long or short, you'd think it would be easy to make a fortune.?
One small problem: A stock may look good or bad fundamentally ? and may be clearly undervalued or overvalued - but that doesn't mean it's READY to move.
That's where the chart patterns come in.
They lead us to the right stocks at the right moments. Especially when they're combined with the fundamental power of the?Zacks Rank.
This is an explosive mix. Our stock search begins with Zacks Rank companies that recently had their earnings estimates revised upward by analysts. History shows that these stocks will move in 1 to 3 months.
What if you could know, with greater precision, the right days to buy and sell such stocks? What if you could focus on only 5 to 7 choice stocks rather than thousands? Imagine how much money you could make!
Since 2000, I've worked the Zacks Rank system every which way, and used Zacks research to build more than 30 stock-picking strategies.
Several of these systems reach spectacular yearly average gains of +60% and more. I've shared some of these secrets (but not all of them) on Zacks.com and during appearances on CNBC.
Here's the exciting news: Today, as new promise is reshaping the market, I'm prepared to share these picks with you. Not in theory. Not on talk shows. But in day-to-day real time.
Introducing the Zacks Chart Patterns Trader: Earnings fundamentals PLUS pinpoint technical timing.
![]() We do the work for you.
We do the work for you.
Kevin Matras and his team probe for the BIGGEST profit moves:
8,500 stocks
will be screened down to a potent few.
4,400 stocks
will be checked for the Zacks Rank.
100 stock chart patterns
will be visually examined every day.
5-7 recommendations, on average,
will be in the portfolio at any given time.
?
I hope you'll take advantage of this opportunity to join our private and limited group of investors. We analyze the Zacks Rank and other fundamental factors, then go beyond the computer printouts.?
Our team visually examines more than 100 stock charts every day to find patterns that signal the "kickpoint" when profit moves begin.
Their mission: Find high probability price-action patterns that are immediately in play.
I'd like to emphasize that, despite this mission, our investment philosophy hasn't changed. We still believe that fundamentals determine the price or value of a stock.
But we also know that technical analysis of chart patterns adds new dimension to your trading. It signals when the market is ready to react to those fundamentals.
Why is this important? I'm sure you and your broker often find strong companies that don't seem to go up as you expected. How many times have you been excited by a certain stock, bought it, and then watched the market go the other way?
"Off-the-Charts" success rates of 70%.
For centuries, a handful of savvy investors have quietly made money on price movement trends. The Fed, in fact, has long recognized the power of chart trading. "Technical analysis has been shown to generate statistically significant profits," according to a report issued by the Federal Reserve Bank of New York.
Some of these patterns are in the money an amazing 7 out of 10 times. But remember that only a few?experts are able to . . .
- Find stocks that are suddenly increasing their fundamental strength.
- Spot chart patterns in their price movements that signal when to buy and sell.
- Take timely advantage of that information - and apply it through longs, shorts, ETFs, and other investment vehicles that target strong gains no matter what the market is doing.
In other words, this is your chance to get aboard 5 to 7 stocks that most traders simply won?t find in time. Get them today.
For example,?I detected the technology giant, Honeywell (HON) just before its price exploded upward . . .
Hidden Chart Pattern Foretells +23.7% Gain in Only 20 Days
Triangle Pattern Hidden Here
To the untrained eye it looks like any old chart.
Triangle Revealed
But will you find out in time to catch its profit breakout?
Explosive Upside Breakout
HON soars +23.7% in just 20 days!
Some services point out these patterns after they?ve happened and the trade has gotten away. What?s the point of that??It?s like whispering the winning lottery ticket number to someone after the contest is over.
Instead, I?m sure you?ll want to know about that stock before the breakout happens, or at the moment it begins.
This is your opportunity to get in on?our recommendations before the rest of the world notices them.
We're zeroing in on three sectors today.
In fact, I'm targeting two that I believe are ready to plunge. (Most of the people on TV have one of them dead wrong.)
Likewise, there's another sector in particular that will shine as a safe haven, even though it's never been conisdered that in the past.
We?d like you to get aboard and start following profit moves as soon as possible. So, if you're hesitating about receiving the timely picks and insights, please consider this . . .
| ? | TWO MONEY-BACK GUARANTEES | |
| ? |
 |
 |
We?re actually guaranteeing your satisfaction with our trading service. It?s backed with not one but two full-refund guarantees:?
- First, you may cancel within 90 days for any reason and get all your money back, no questions?asked.
- Secondly, the Zacks Chart Patterns Trader comes with a full-refund performance guarantee.
That?s right. It?s GUARANTEED to beat the market or you?ll get your money back!
You may very well ask, ?If I follow the Chart Patterns Trader recommendations and they don?t beat the market, why should I pay for the service?"
Well, in that case, we don?t think you should have to pay for it either!?
We know the power of combining Zacks Rank fundamentals with pinpoint technical timing. That's why we're guaranteeing the service's performance in this manner: If the Zacks Chart Patterns Trader doesn't beat the market for you, simply let us know and we'll refund your subscription. Every cent.
|
Buy the Right Stock and Sell It at the Right Time
|
This guarantee is not just for 30 days or 90 days. It's good for the LIFE of your annual membership. I can?t think of a better way to emphasize the power of these recommendations. Click here for details.
Zacks Chart Patterns Trader is a significant bargain at its regular annual price of $1495.? That's?only about $4?per day and far below other services (priced at $5000) that do not have two profound advantages: (1) the predictive power of the Zacks Rank and (2) the precision timing from analyzing chart patterns that show price movements.
What's more, you may be able to use your Chart Patterns Trader membership as a federal tax deduction. (We don't offer tax advice -- please check with your tax specialist for specific IRS guidelines on deductions.)
| ? |
 |
FREE BONUS: The Key to Understanding Chart Patterns
Although this service will do the hard work for you, providing a supply of fresh, well-timed recommendations, you may want to deepen your personal knowledge. So when you become a member, you'll receive the complete Chart Patterns Trader Supplement: Understanding and Trading Classic Chart Patterns. You'll learn how to spot "hidden signals," just before a stock surges skyward.
?
?
| Another bonus for members: Daily updates and commentary |
|
Each day, we'll give you the picks, their "Price Added" and "Last Trade," so you can see at a glance how they're doing. Plus, you'll receive quick insights from Kevin Matras about the picks and also about the markets in general. Members love this commentary. C.L. from Falls Church, VA reports, "I really appreciate the daily updates. They are informative and succinct (giving, for me, just the right information), and they're upbeat....It really feels like you're chatting in a casual comfortable way, but taking care of business very efficiently. I look forward to each evening's email. I know I shouldn't have emotions about investing, but it does sort of feel that I'm waiting to see what new thing Santa has left under the tree. So far, I like what he's brought." |
![]() Don't miss these powerful picks
Don't miss these powerful picks
If you want to outperform the market no matter which way it springs, and are ready for stock picks that combine the power of fundamental and technical signals ? this is the trading alert service for you.
Even during bearish times, it has received rave reviews: "For me the best test of any stock-picking program is how it performs in a down market and the Chart Patterns Trader has fared far better than any of?the major indices" says Brian S. of Simi Valley, CA. "Kevin Matras's ability to pick stocks just before they break out is amazing."
Neal B. from San Antonio, TX insists "I refuse to accept as satisfactory a performance that matches the market. My experience with Chart Patterns Trader has been very good to this point."
Today, the Chart Patterns Trader is detecting another imminent breakout. So please don't wait?another minute. Call toll-free at 1.888.775.8348 9 am to 5 pm CT. Outside the U.S., call 1.312.265.9239. Or join the Zacks Chart Patterns Trader online right now.

Good Investing,

Kevin Matras
VP, Zacks Investment Research
tradingservices@zacks.com
P.S. Remember, you get a risk-free membership, PLUS a Bonus Trading Guide, PLUS new picks that are about to make their moves.
Individual results may vary. To learn more about our performance, go to https://www.zacks.com/performance.
Zacks.com provides investment resources and informs you of these resources, which you may choose to use in making your own investment decisions. Zacks is providing information on this resource to you subject to the Zacks "Terms and Conditions of Service" disclaimer. https://www.zacks.com/disclaimer